Food Inflation in Kenya: Beyond the Headlines
Maize flour is up. Cooking oil is up. Sugar is up. School lunches are up.
The official inflation rate for the month says 5.6%.
Your grocery receipt does not believe the official rate.
The gap between Kenya's published food inflation and what your household actually experiences is one of the largest unexplained discrepancies in Kenyan public statistics. It is also the source of an entire policy conversation we are not yet having properly.
This is what the headlines miss.
Table of Contents
- What "Food Inflation" Actually Measures
- The Real Basket For A Nairobi Family
- Who Absorbs The Shock
- What Drives Food Inflation In Kenya
- What The Policy Conversation Should Be
- What This Means For Households
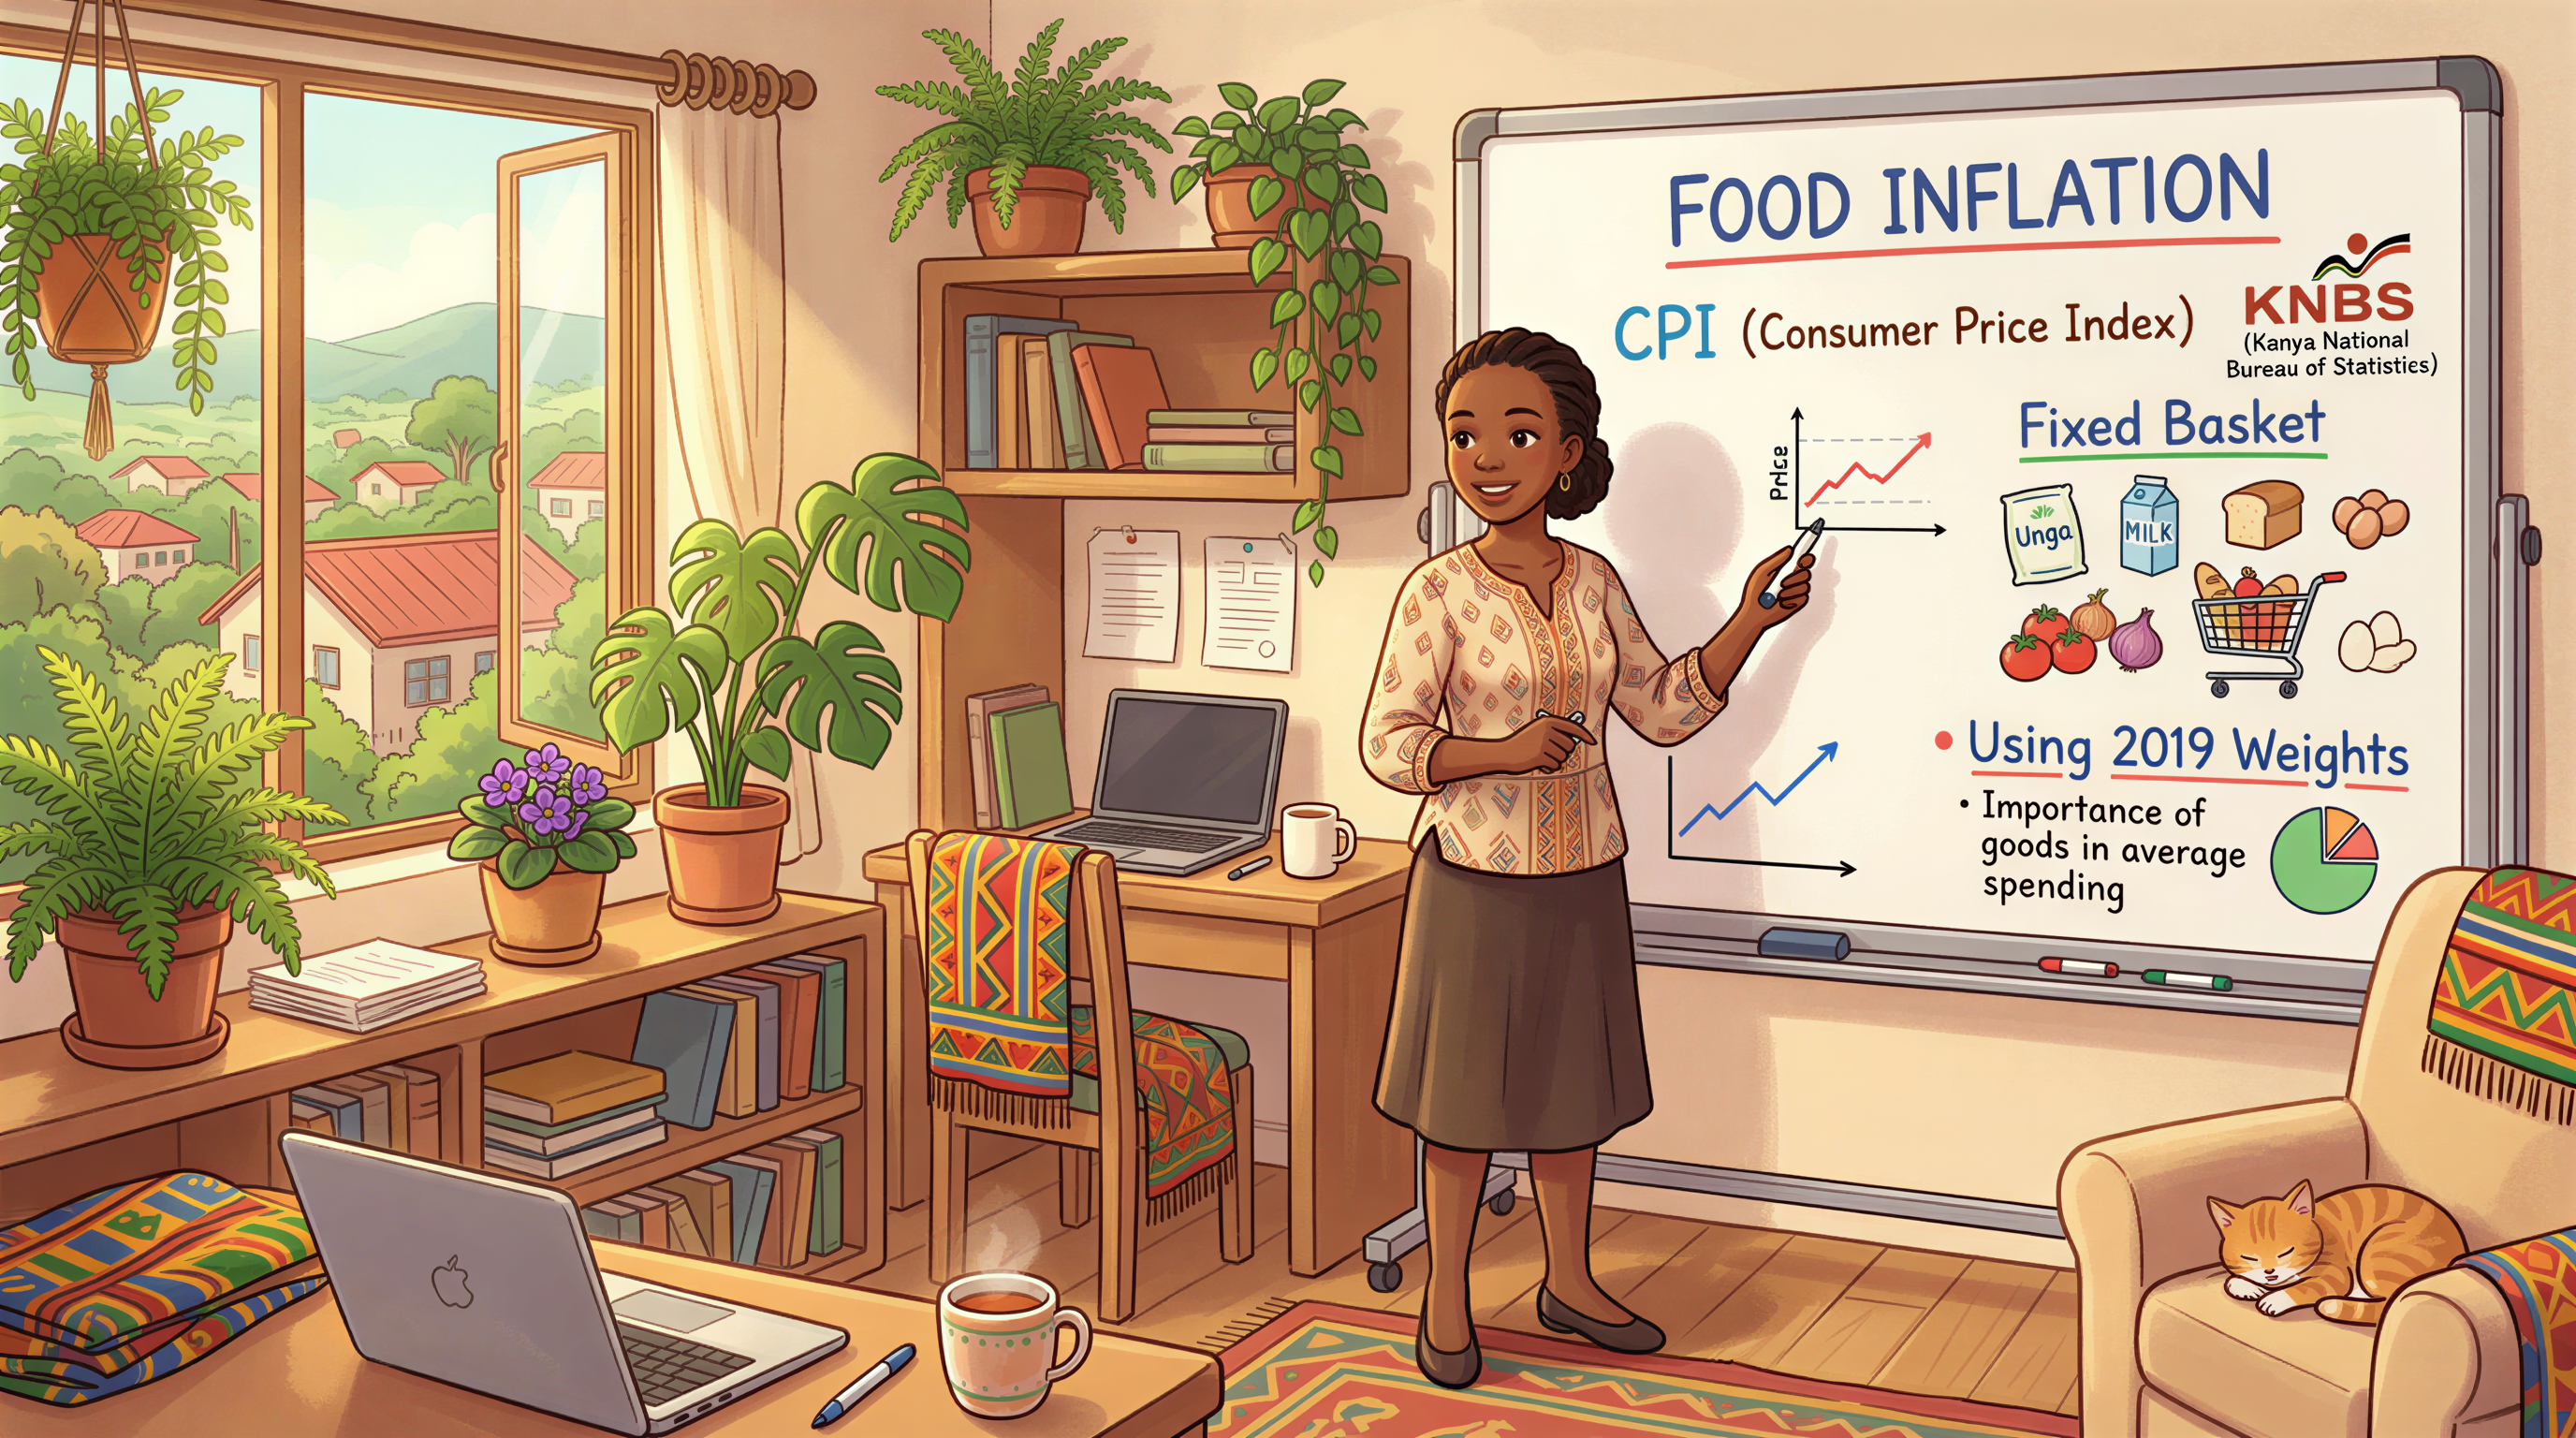
What "Food Inflation" Actually Measures
The Consumer Price Index (CPI) is calculated by KNBS by tracking the prices of a fixed basket of goods over time. The basket is updated periodically — currently the weights come from the 2019 Kenya Integrated Household Budget Survey, which means the "average household" being tracked is six years out of date.
For food specifically:
- The CPI tracks ~250 individual food items
- Each is given a weight based on the average household's spending
- The aggregate movement is the food inflation rate
- The geographic sample is mostly urban, with some rural representation
This methodology is internationally standard. It is also, by design, a lagging and averaged measure. It is not designed to tell you what your household is paying. It is designed to give the macroeconomic picture across all households.
Three structural reasons your kitchen disagrees with KNBS:
1. Weights are out of date.
If your household now spends a higher proportion of its income on cooking oil and lower on, say, soda, your inflation rate is higher than the average. The CPI has not yet caught up to the post-2022 cooking oil shock.
2. Your basket is different.
The "average household" is a fiction. Low-income urban households spend roughly 50% of their income on food. High-income households spend around 15%. A 10% jump in the price of unga affects the two profoundly differently — but the CPI weighs the average movement.
3. Quality and quantity changes are invisible.
When sugar's price stays flat but the bag size shrinks from 2 kg to 1.8 kg, that is real inflation. The CPI captures it imperfectly. Your kitchen captures it precisely.
The Real Basket For A Nairobi Family
Let me show what household-level inflation actually looks like. This is a typical Nairobi family of five (two adults, three school-age children) spending KSh 35,000 a month on food.
| Item | Apr 2024 | Apr 2026 | % change |
|---|---|---|---|
| 2 kg unga | KSh 220 | KSh 310 | +41% |
| 1 L cooking oil | KSh 270 | KSh 380 | +41% |
| 1 kg sugar | KSh 180 | KSh 250 | +39% |
| 1 tray eggs (30) | KSh 380 | KSh 470 | +24% |
| 1 kg beans | KSh 130 | KSh 200 | +54% |
| 1 kg rice | KSh 160 | KSh 220 | +37% |
| 1 kg sukuma | KSh 40 | KSh 60 | +50% |
| 1 kg beef | KSh 540 | KSh 720 | +33% |
| 1 L milk | KSh 70 | KSh 95 | +36% |
Weighted basket inflation for this household over two years: approximately 36–42%.
Published CPI food inflation for the same two-year period: approximately 18–22%.
The gap is roughly 2x. That is not a measurement error. That is a measurement frame.
Who Absorbs The Shock
Inflation is not evenly painful. The same 30% rise in unga prices does very different things depending on where in the income distribution a household sits.
Top 20% of households:
- Food share of income ~15%
- 30% food inflation = ~4.5% loss of disposable income
- Adjustment: minor brand swaps, slightly fewer restaurant meals
- Health impact: negligible
Middle 40%:
- Food share ~25%
- 30% food inflation = ~7.5% loss of disposable income
- Adjustment: cut treats, switch protein sources, less variety
- Health impact: modest in adults; meaningful in children if it persists
Bottom 40%:
- Food share ~50%
- 30% food inflation = ~15% loss of disposable income
- Adjustment: skip meals, switch to cheaper carbohydrates, drop meat and fruit, increase dependence on cheap UPFs (mandazi, biscuits, maize-flour-and-sugar tea)
- Health impact: directly trackable in stunting, maternal anaemia, child wasting
The same statistical inflation produces three different countries inside Kenya. The CPI averages them.
This is the conversation we should be having instead of arguing about whether the headline rate is "really" 5% or 7%.
What Drives Food Inflation In Kenya
Five structural drivers, in rough order of weight.
1. Imported input prices.
Cooking oil, fertiliser, wheat, sugar — Kenya is heavily import-dependent on these. A weak shilling, a spike in global crude oil, or a Black Sea export disruption hits Kenyan kitchens within 6–12 weeks.
2. Climate and weather variability.
Erratic rainfall in maize-belt counties, livestock losses in ASAL counties, drought-then-flood whiplash. The frequency and severity have been rising. Domestic food production absorbs the shock unevenly.
3. Currency.
When the shilling weakens against the dollar, every imported food item gets more expensive in KSh terms. The 2022–2024 shilling slide propagated through kitchens for two years.
4. Cartelisation in some sub-sectors.
Sugar, maize milling, cooking oil — each has had moments of market concentration that have allowed price-setting beyond what cost structures would explain. The Competition Authority of Kenya has investigated several of these. The findings move slowly.
5. Tax and excise changes.
VAT on bread, excise adjustments, fuel levy effects on transport — the tax side adds 2–5% in most years and is the most policy-controllable lever.
Of these, only the last two are directly under domestic policy control on a short horizon. The rest are exogenous.
What The Policy Conversation Should Be
Three threads.
1. Strategic grain reserves that actually function.
Kenya has had a Strategic Grain Reserve concept for decades. In practice, it has been over-politicised, opaquely managed, and rarely deployed effectively to smooth domestic prices. A functional reserve — well-resourced, transparently managed, automatically activated at price thresholds — would protect low-income households more than most other interventions.
2. Fortification as inflation-proofing.
When inflation pushes households to cheaper carbohydrates, fortification becomes more important, not less. A fortified bag of unga is a partial micronutrient floor for households that are losing everything else from the plate. Fixing the fortification audit problem becomes urgent.
3. Cash transfers indexed to food inflation.
Existing cash transfer programmes (Inua Jamii, Cash Transfer for Orphans) are not indexed to food inflation. In real terms, the transfer value has fallen by 30%+ over five years. Indexing the transfer to a properly-constructed food-only basket would protect the most vulnerable households without expanding the programme.
None of this is exotic. All of it is pending.
What This Means For Households
If you are reading this from a household feeling the squeeze:
- Track your real basket. Write down what you paid for unga, oil, eggs, beans, milk in January. Compare in July. You will be sharper at decisions than the published numbers can make you.
- Shift toward foods whose prices are less volatile. Beans, eggs, sweet potato, and seasonal produce are less import-sensitive. Cooking oil and wheat-flour items are the most exposed.
- Reduce the "leak" categories first. Soda, snacks, takeout, packaged "convenience" items — these are the inflation amplifiers. Real food at home is more inflation-resistant.
For the household-level playbook, see eating well on a Nairobi salary.
The headline rate is not your rate. The basket the government tracks is not your basket. The gap is real. The policy conversation should start from your kitchen, not the press release.
For now, your kitchen is on its own. Stock it well.